FEATURED POST
featured post
#ESG reporting
Clouds on Mars as the Key Microsoft Technology Partner at COP28 UAE
news from mars
view more posts
The Significance of ESG Data Visualization
ESG Metrics: From Compliance to Competitive Advantage – Insights into Standards, Reporting, and Tech Innovations
Corporate GHG and Scope 3 Accounting
Mandatory Due Diligence in ESG reporting
What is ESG risk management?
Jak zarządzać danymi z zakresu Taksonomii UE w branży finansowej?
Innovation in ESG reporting starts with data collection
Innovations in ESG reporting
#PowerPlatform
What is Data Lakehouse Architecture?
What is Business Intelligence?
Data Analytics – what is it and what is the role of DA?
#Sustainability
ESG Reporting – Why is it so important to companies?
Microsoft SAP ERP Connector for Power Platform
Automate manual processes with Microsoft Power Platform
Microsoft Cloud for Sustainability and Sustainability Reporting
Sustainability strategy and compliance are all about focusing on the data
Energizing ESG with Open Data and Power BI
SDGs, ESG, CSR, and Sustainability – how to avoid confusion about these terms and where to start the real change
#UXinModernBI
5 principles of a great dashboard design
How UX adoption can improve Business Intelligence
Business Value of UX/UI Design
Choosing The Right Graph: Part 2
Choosing The Right Graph: Part 1
Visualizing Performance
10 Nielsen’s Usability Heuristics for UX Design
Five Components of a Good Power Platform Support
Understanding User Flows
Wireframes, mockups & prototypes
Introduction to visual hierarchy
#AzureSynapse
What is Azure Synapse analytics?
#CarbonNegative
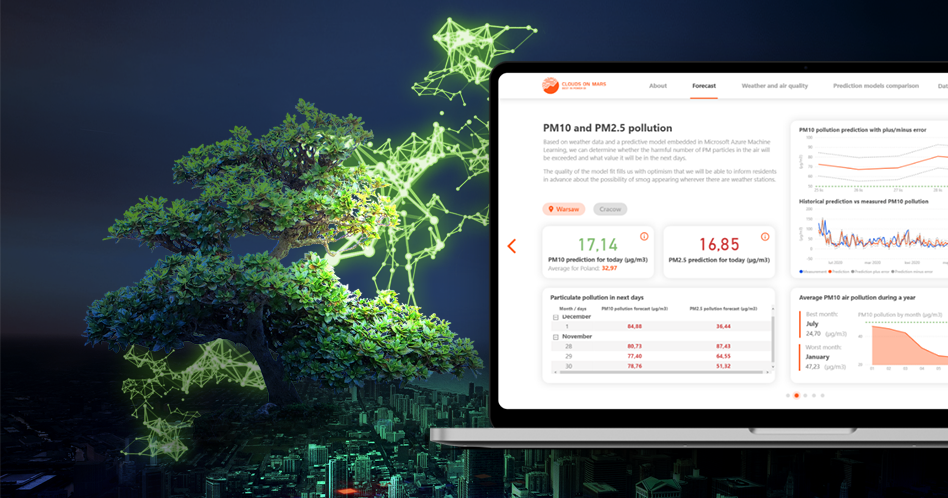
Fighting air pollution with data and AI
Useful tools for report design
The art of data visualization
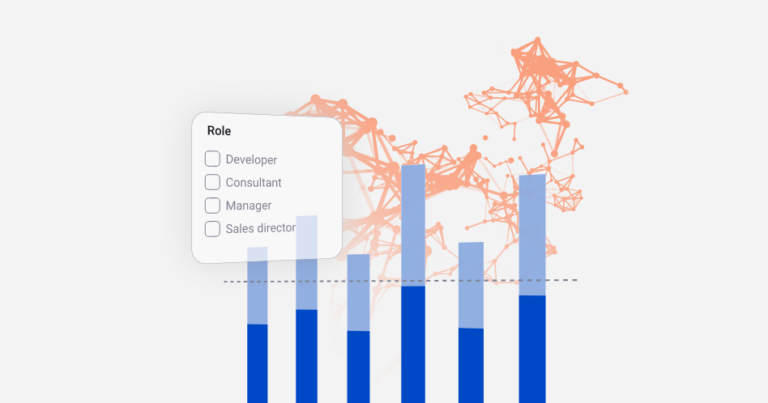
Data filtering and interactions in modern BI reports
UX&UI – What’s the difference?
Problematic charts in data visualization – pros and cons
Choosing the right direction of your story
#PowerAppsForBusiness
Power Apps: Planning phase
Power Apps: Design phase
Designing CTA buttons and navigation strategies
Understanding layout
From cave paintings through hieroglyphs and movies to report design
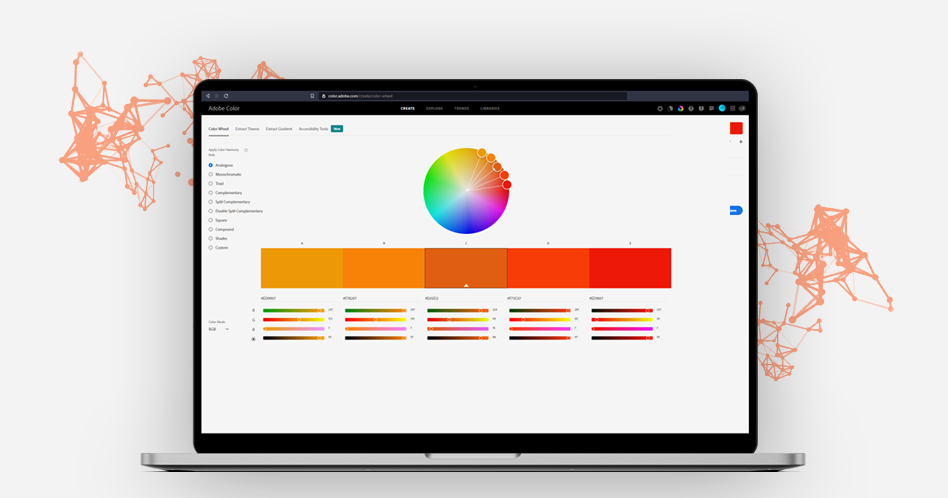
Color vision deficiency and data visualization
How Mars became green
contact