

By Wojciech Bąk
For many of my sustainability projects, the main issue was to find a benchmark for ESG measures and KPIs. How can you tell if your organization is operating responsibly if you lack information on the usual rates of emission, water usage, or effects on the regions and societies around you? How can you feel satisfied if you can’t measure and monitor the impact on children, education, or even risks for everybody? Unfortunately, the biggest issue here is access to data, since this is not information from your organization but the world around you.
Luckily for us, with SDGs, the UN has thought about opening datasets and promoting such an approach for other organizations as well. Open Data can help achieve the SDGs by providing critical information on natural resources, government operations, public services, and population demographics. These insights can inform national priorities and help determine the most effective paths for action on national issues. It also can help to effectively connect your ESG priorities, with the biggest issues in the population from a specific region and measure progress on a higher level than just your company.
Using this paradigm, during the Microsoft Swiss Power BI Championship, we have been encouraged to use Power BI and prepare great analytical solutions based on publicly available WHO data (https://www.who.int/data/gho/info/gho-odata-api). That’s how “Monitoring Health For Sustainable Development Goals” has been created by me and Greg Stryjczak.
Our Goals and Principles
Before we started creating a solution, w had to define what questions we want to answer and what data story we want to tell with our dashboard. After long discussions we decided to focus on children mortality around the world but also address business value and technical excellence:
MULTIROLE Data Story:
- Tool for a broad audience
- Application-like UX, simple to use with great design
BUSINESS value:
- Easy expansion and generic approach to KPIs
- Added value creation with multi-source data integration
TECHNICAL Excellence:
- Flexible and automated data refresh
- Leveraging all good practices for Power BI
- Enhancement with Power BI AI features
With the initial assumptions, we worked on the next step – the data story.
Our Data Story
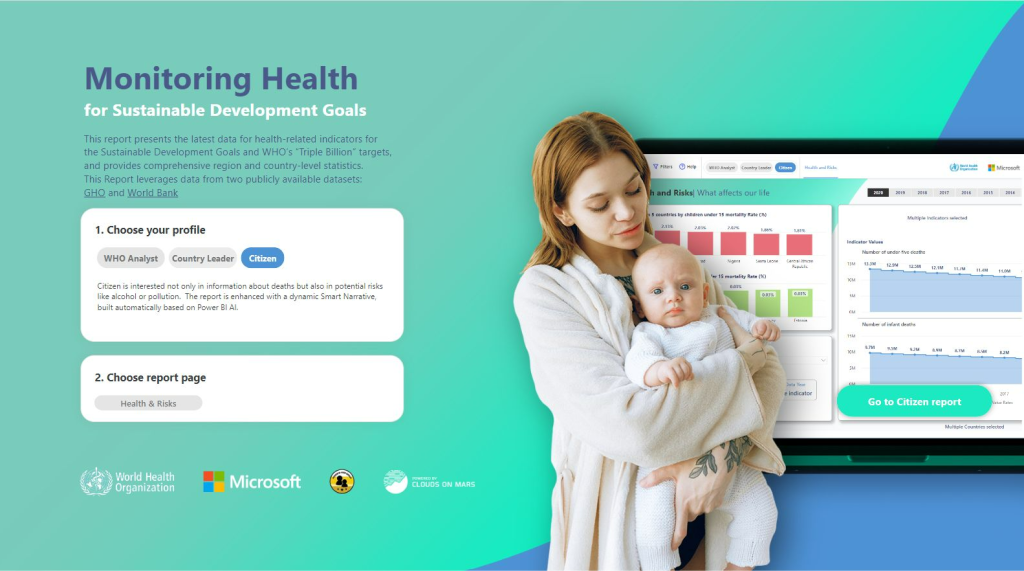
I’ve heard once, that a good analytical solution is like a good joke, you don’t have to explain it. That’s why we wanted our dashboard to be self-explanatory and so that the average citizen can learn some interesting facts from it. Nevertheless, we included other roles as well:
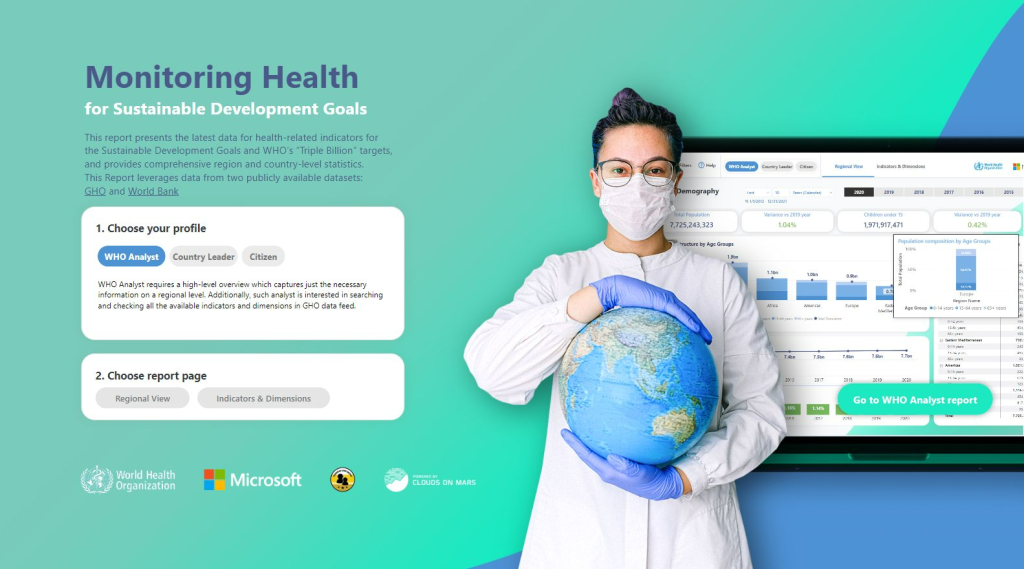
WHO Analyst
- Looking at the most aggregated picture
- Access to very detailed indicator information
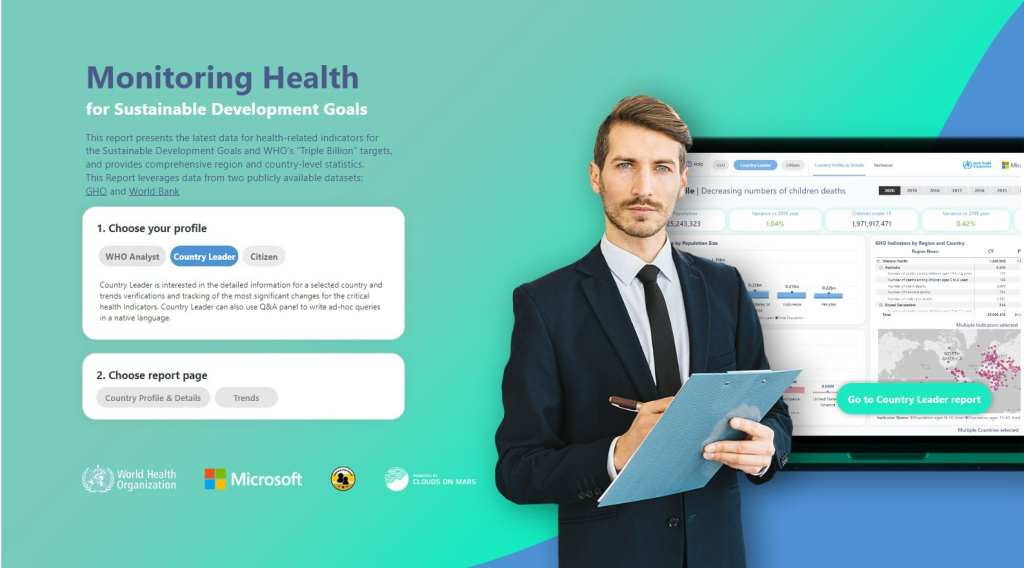
Country Leader
- Country benchmarking and data verification
- Supported with native language Q&A
Citizen
- Possibility to check all available KPIs
- Supported with automated Smart Narrative
Based on the above, we had just a few days to integrate data, enhance it with additional information from the World Bank open dataset (https://data.worldbank.org/indicator), create a data model, and build logic, calculations, and visualizations. It wouldn’t be possible without such a great tool like Power BI.
Results and next steps
The final results exceeded our expectations with all the positive feedback we received. Even more important were questions to enhance our dashboard with new measures and KPIs. Thanks to the content of the solution, people were able to navigate through more than 2000 WHO indicators looking for interesting information on water consumption, effects of pollution on our health, and many more. Moreover, some of the indicators can support our customers in defining direction and priorities for their ESG projects, but even here we have been asked for more.
Lucky for us, we have prepared our loading processes for such a situation and soon we will be able to present you with even more interesting insights and analyses. Stay tuned and for now, you can check the dashboard yourself (Monitoring Health).
If you are interested in hearing more, connect with me our my ESG team at ESG@cloudsonmars.com
Read more about sustainability:
SDGs, ESG, CSR, and Sustainability
Data-driven solutions for compliance in sustainability
ESG Reporting – Why is it so important to companies?
Microsoft sustainability reporting