
Clouds on Mars is not only Best in Modern BI, working with enterprise clients around the world and focusing on Microsoft technologies, but we are Carbon Negative as well. We are fully aware of impact on environment that comes with running a business, that is way they decided to eliminate whole carbon footprint and reach a negative level of net carbon emission by taking part in eco-friendly activities such as afforestation, reducing paper usage and eco education. In this article, we are diving deep into the origins and process of creating our air pollution report that uses Artificial Intelligence, Machine Learning, and cutting-edge technologies such as Azure, Databricks or Power BI. Same report which allows us to make very accurate predictions for harmful PM10 and PM2.5 particles in the air we all breath.
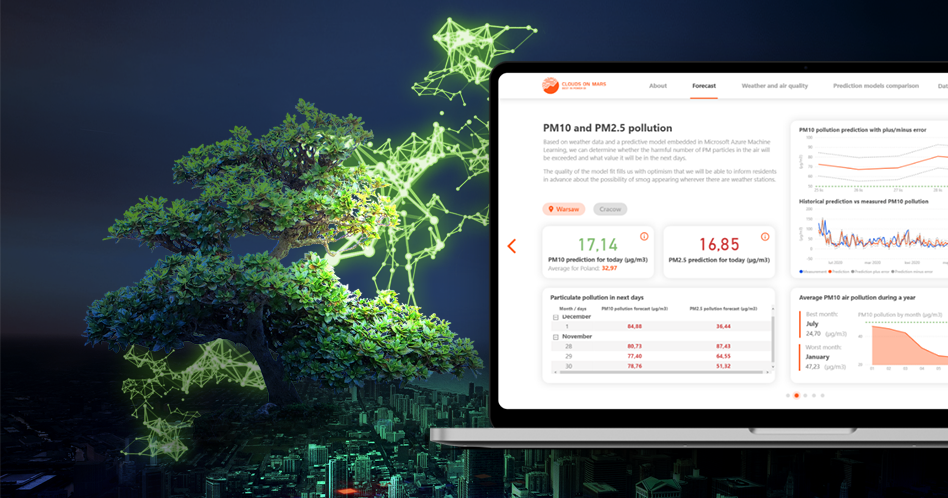
Air quality prediction tool, which uses AI and machine learning
Air pollution is one of major environmental issues in Poland that has direct impact on human health causing premature deaths due to cancer and other respiratory diseases. Unfortunately, Poland remains among the most air-polluted countries in Europe, exceeding the WHO norms of PM10 and PM2.5 particulate pollution especially during the winter months. Having that in mind, we decided to create a tool that would enable people to see air pollution forecast for the next days and raise the awareness of the problem.
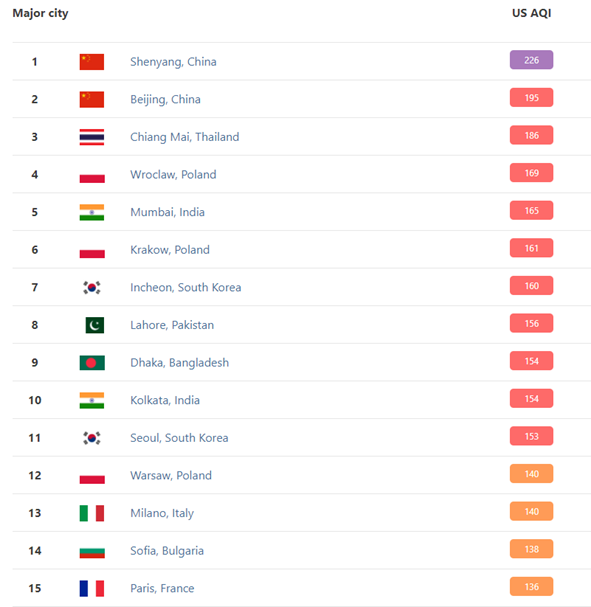
Picture: cities with most polluted air as of March 10, 2021. You can see that among top 15 cities, 3 are polish cities (source)
Explaining the magic behind the report
Data collection
Data was obtained from stations measuring the level of air pollution in Warsaw and Krakow, the two largest cities in Poland that have been struggling with the issue of smog for many years. Flat CSV datasets were downloaded from polish environmental inspectorate and then transferred to Azure Data Lake. To make prediction model accurate, able to learn by itself, and find the most relevant variables based on which we can predict the level of harmful particles in the air, more weather data had to be added to our database. Historical weather data was obtained from polish Institute of Meteorology and Water Management. The challenge was in choosing the right data from the smog stations in Warsaw and Cracow, as many of them were located on less relevant regions such as forests and green areas. After inspecting the data, the number of applicable air pollution stations was limited to 3 in Warsaw and 6 in Cracow. The primary explained variables (endogenous variables) were the level of presence in the air of the following molecules: NO2, O3, SO3, CO, and PM10 and PM2.5. Due to limitations in data availability, we focused on PM10 and PM2.5. PM values inform us of air pollution with particles with a diameter of 10 microns or less, and 2.5 microns or less, respectively. The explanatory variables (exogenous variables) in our model, were weather indicators, which include maximum and minimum average temperature, daily precipitation, average wind speed, level of cloudiness, atmospheric pressure, and air humidity. All these variables were considered as daily indicators. We used this dataset to predict the level of PM10 and PM2.5 air pollution.
Data processing and finding the right prediction model
To give our model machine learning capabilities, we used weather and air pollution data. Based on the correlation analysis, we concluded that there is a statistical relationship between the number of harmful PM10 and PM2.5 particles and atmospheric factors such as temperature, wind speed or air humidity. It can be concluded that the higher the temperature and the higher the wind speed, the less often residents deal with harmful particles in the air.
Based on selected variables, we have decided to build predictive models. Among considered algorithms were: Multilayer Perceptron, Support Vector Machines, Gradient Boosted Trees and Deep Neural Network Regressor. After analysing average prediction errors, we found that the Gradient Boosted Trees was the most appropriate model for the PM10 and PM2.5 prediction.
After the model was selected, we needed a data source that would fuel our prediction engine. For that purpose, we use data from openweathermap API that is collected using Azure Function Apps and transferred to SQL via Azure Data Factory every hour. Then, the calculated average values are being saved to Azure SQL Data Warehouse. In the last step, our prediction algorithm running on Azure Databricks calculates the PM10 and PM2.5 pollution forecast for current day and the next 5 days. To check the quality of our prediction we are using airly.org air pollution measurement data that is stored in our cloud database and is used for comparison between actual data and calculated forecast. All data is presented in user friendly form in self-refreshing Power BI report that you can find here.
Data is the beginning
Our experience and expertise gained through past commercial projects allowed us to use cutting-edge cloud and BI Microsoft’s technologies to raise the awareness of one of the most major ecological challenges that Poland is currently struggling with. Our work resulted in creation of always up to date, self-refreshing report that enables users to learn more about current and future air pollution conditions in two major polish cities. However, we are not stopping there, and we are constantly working on finding new ways for eco education and making positive impact on the environment.