

by Agnieszka Bąk
The second article in a series about innovations that can be applied to ESG reporting talks about a stage that no report creator can skip – the collection of data. Read about how to use innovative solutions to gather necessary data and prepare proper ESG reports according to the Corporate Sustainability Reporting Directive which is now in force for EU countries.
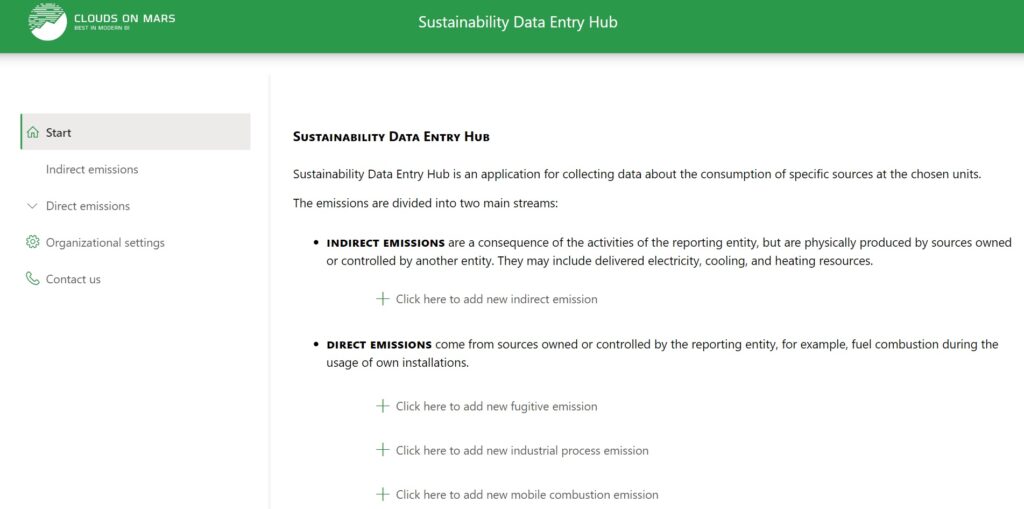
The ESG reporting process starts with data gathering, especially in a specific location like a warehouse or store. Mobile forms of data implementation are particularly good to have on hand there, for example on a mobile phone or a tablet. This is a perfect space for a Microsoft Power App custom solution. Data could be divided there into pillars according to GHG (Greenhouse Gas) emissions methodology and then integrated with external databases like SharePoint or Dataverse.
The challenges of obtaining data in ESG Reporting
The main problem at the moment is that data is not just dispersed; mainly, there is no data or data provided on the invoices is completely inconsistent. The system that will digitalize data on site and then it in one place could be the first step. Just around the situation where data could be identified. This also could be treated as a raw DWH – Data Warehouse.
Simultaneously the main market pain point is that the new regulation induces demand in GHG scope 3 data. Obtaining GHG data linked to purchasing goods and services is incredibly challenging for every company. In the absence of international GHG data collection and data exchange systems, companies need efficient and robust tools to identify GHG mission hot spots along their supply chains. In this regard, there is a growing interest in scientific methods such as life cycle assessment and environmentally extended input-output (EEIO) models. One might say that none of these methods is new. This statement is correct for science only. Using any of these methods in business applications should be seen as a very innovative approach.
The potential of extended input-output models in ESG reporting
In particular, EEIO gains momentum. The growing capacity of computers and the availability of good-quality databases make EEIO a perfect tool for discovering a company’s supply chain emissions. Some reporting tools already use generic EEIO multipliers, giving some but rather limited knowledge about the emission sources. Tailor-made EEIO analysis provides a much deeper understanding of the company’s impact on GHG emissions and should be a first choice. EEIO is a fantastic tool for every company obliged to report scope 3 GHG emissions, especially when integrated into the broader BI ecosystem.
The collected ESG data can be used not only for the legally required sustainability reporting. A modern approach, such as data democratization, can be implemented to use and analyze valuable information in other areas of the business. This process provides access to data analysis for everyone in your organization, including non-technical users. The benefits of introducing Data Democratization are, for example, quick access to reliable data, time-saving, the ability to draw further conclusions, and data-driven decisions. With this data management strategy, the company will stand out as a potential investment or supplier.
Choosing the right ESG analysis and reporting tools
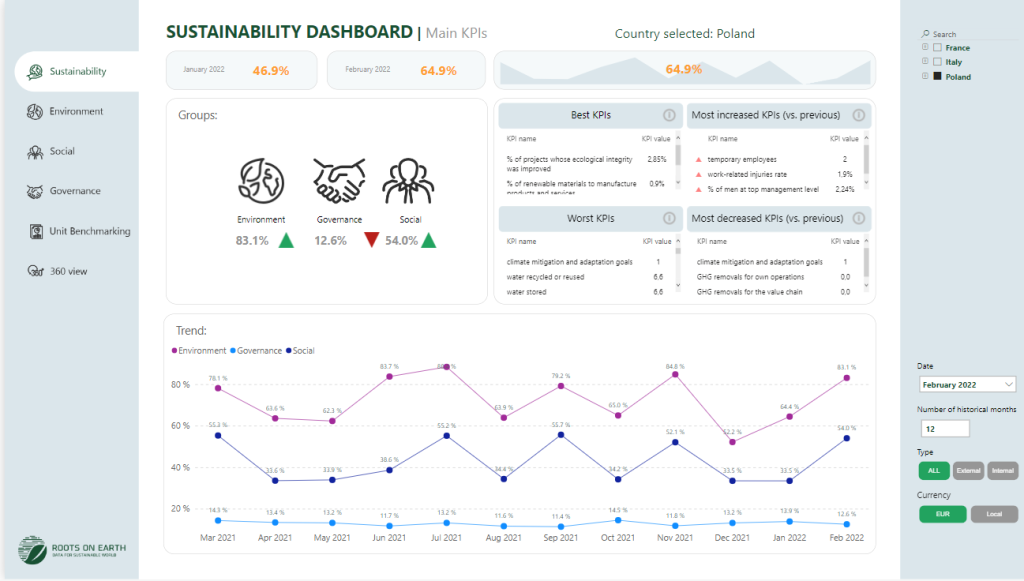
At the end of the process, it is all about the right tool which could be integrated with innovative or new additional utilities to support data collection. There are ready-made ESG reporting tools available on the market. For example Microsoft Sustainability Manager. Allows to gather, analyze, and track the dispersed data almost in real-time, so it can be easily integrated with any business system by automating data connections. It centralizes previously disparate data in a common data format and offers organizations an increasingly comprehensive view of the emissions impact on their entire operations and value chain. Microsoft Sustainability Manager is based on Power BI, which is treated as a kind of successor to the immortal Excel. Worth to mention that Power BI is fit for all utilities to analyze and conduct visualization of any environmental, social, and governance data.
However, Power BI is not only a tool for creating reports but allows you to interact with data. Thanks to this technology, it is possible to carry out advanced analyzes, examine the impact of selected factors, and use benchmarking. Using what-if analysis, we can check different scenarios depending on the assumed parameter. It is also possible to analyze trends as well as forecasts, which can have a significant impact on making forward-looking decisions. With this tool, you can create user-friendly visualizations that let you work interactively, decide on the direction of analysis yourself, and get actionable insights.
In short, Power BI allows looking deeper at the available information and creating a data story, which will enable action based on understanding the data in the field of ESG and will allow you to set specific goals and the ability to monitor them.
How can I improve my ESG report?
Integrating and maintaining ESG practices is at the top of the priorities for all organizations in the scope of the CSRD Directive from the long-term perspective and businesses’ survival. As the market is shifting to responsible investment quantifying ESG models with the proper tools and innovative solutions growing to be the IT and data management challenge for the next few years. No data is equal to a risk of noncompliance or, what is worst, the lack of access to financial instruments. The integrated ecosystem of IT solutions and products could finally support organizations in the full loop of ESG data management. Starting from the collection via digitalized and AI-supported solutions with Power App, then connected via IoT with the storage place in the cloud and automatically transferred to the proper ESG tool with implemented GHG analytics methodology and ending on the advanced analytics and reporting equipment like Power BI.
The good news is that using modern IT tools allows you to collect hard-to-reach data such as GHG emissions from Scope 3 and manage it efficiently. Having access to such essential information, you can use the analytical tools available on Power BI. With Power BI technology, you can analyze data and prepare a report following current guidelines.
Access to modern tools such as IoT, AI, and Power BI technology allows you not only to create a good report based on reliable data but also to plan an ESG strategy and be a leader in sustainable development.
If you want to deep dive into our ESG solutions or just need help understanding the ESG impact on your business and how the above tools could be adjusted to your demands do not hesitate to contact our ESG team at ESG@cloudsonmars.com
Read more about ESG Reporting on our blog:
Innovations in ESG reporting – Part 1
Microsoft Cloud for Sustainability and Sustainability Reporting