
Let’s jump back to the topic of choosing the best chart for any data type. This article is part 2 of our small crash course dedicated to the topic of data visualization types – if you haven’t read it, I strongly encourage you to catch up on part 1 where we discuss the best graphs to compare data, visualize status, and composition.
Best graphs to visualize trends
Line charts
This is probably one of the most frequently used chart types, in most cases to show trends over a specific period of time. As simple as it may seem, there are still some good practices and things to consider when formatting and polishing your visualization:
- If you enable labels for data points, consider disabling Y-axis not to show unnecessary information.
- It’s a good idea to show data point markers, however, if you’re dealing with high-density samples you should stick with markers disabled.
- If you’re plotting multiple series it’s a good practice to use different line styles and marker shapes as you shouldn’t depend only on colors for differentiation between series when possible.
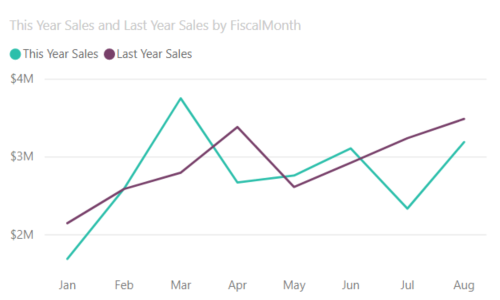
Line chart (image source)
Funnel charts
A funnel chart is a specialized type of data visualization that shows streamlined data, often used in sales or business contexts. Each slice of the funnel represents a step in the process and the bottom slice represents the final data at the last stage.
Best practices for using funnel charts:
- Show at least two stages – if your process has only 2 stages, using a stacked bar or column chart would be a better idea.
- Use a bar-style funnel chart – this creates less room for misunderstanding of the data.
- Make sure that your stages are displayed in the correct order.
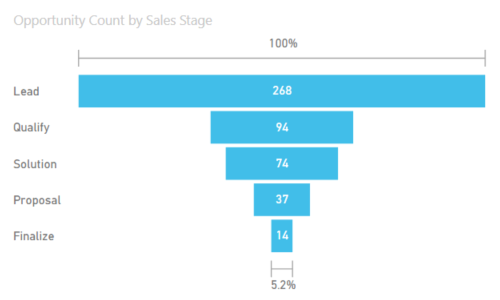
Funnel chart (image source)
Column charts
Column charts can be also used to display trends over a specific period of time. They can be also used to compare items in a given range of values, however, using a bar chart is often a better option as it doesn’t imply that the data is plotted in the time domain.
When you should use a line chart and when column chart? I’d say that the rule of thumb is, that if you want to easily identify a time bucket or if you’re dealing with a small number of samples you should go with the column chart.
There are some things that you should remember when formatting your column chart:
- If you enable labels for data points, consider disabling Y-axis not to show unnecessary information.
- You can use different colors to highlight the most important data.
- It might be a good idea to include a constant line when applicable (for example a median, average, or a target line).
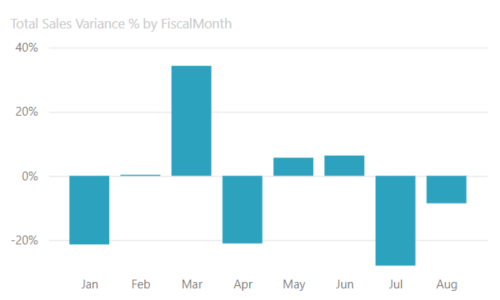
Column chart (image source)
Combo charts
Combination charts, or combo charts, in short, are visualizations that consist of column and line charts. These can come in handy when comparing values in different categories as it gives you a straightforward view of which category is lower or higher (when plotting both series on the same axis). A great example of a use case for combo charts is comparing actual and projected sales numbers over a selected period of time.
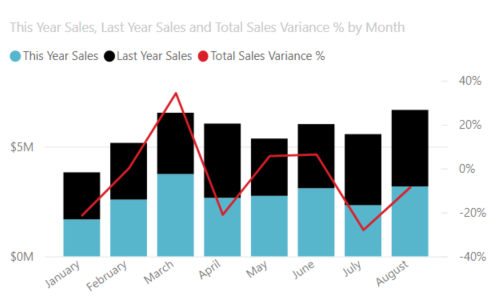
Combo chart (image source)
The best graphs to visualize distribution
Scatter and bubble charts
Scatter plots display relationships between 2 numeric variables. For each data point, the value of each variable is represented by its position on the X and Y axes. Scatter plots are a great tool to identify potential cause of a problem or whether the two variables are related.
When you add another dimension to the scatter plot, it becomes a bubble chart. In this case, the third dimension is represented by the size (radius) of a data point. You can also include several categories in one diagram using different colors, however, you should test your color palette and see if it’s available to the users suffering from color vision deficiency. When using scatter and bubble charts it’s important to show titles for each axis in order not to leave any room for misunderstanding the data. When you’re working with bubble charts, it might be a good idea to indicate what bubble size represents in addition.
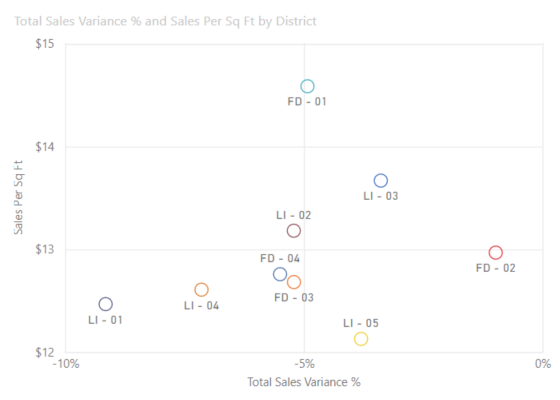
Scatter chart (image source)
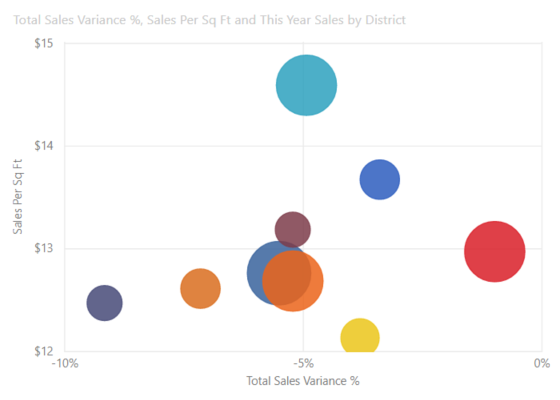
Bubble chart (image source)
The best graphs to visualize geodata
In some cases using map-based visuals might be a good idea when dealing with geographical data. There are several options available such as filled maps, where transparency of a fill color represents a scale, or bubble maps where the same is accomplished by differences in bubble radiuses. As effective as maps may look you should be cautious when deciding to use them, as in some cases the data could be misunderstood – for example, a small region on the map could be unnoticed, whereas that wouldn’t be a problem when displaying the same data on a bar chart.
I hope that this 2-part introduction to basic chart types dispelled some doubts and gave you a little insight into the complex world of data visualization. Remember that there are still almost limitless possibilities and different specialized chart types that you can use, but it’s always important to lay strong foundations before going into the details.
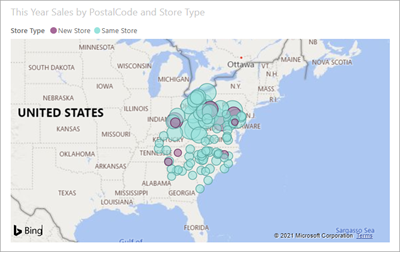
Map visual (image source)
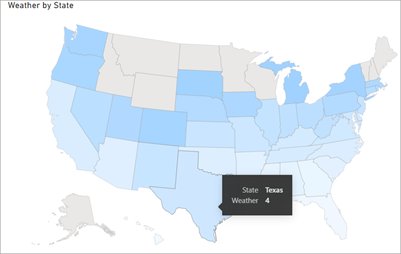
Filled map visual (image source)
Michał Stryjczak
Read more:
Introduction to visual hierarchy
Understanding layout to build user friendly BI reports
Designing CTA buttons and navigation strategies in UX design