Introduction to visual hierarchy
Today I’d like to take a more in-depth look at the topic of visual hierarchy that I previously mentioned in an article about understanding page layout. But let’s start from the beginning and learn what visual hierarchy actually is. What is visual hierarchy? I believe that to many people that have had contact with […]
What is Azure Synapse analytics?

Nowadays Azure Synapse is one of the hottest topics in the data industry. But what it really is and what it can offer to business? In this post, we will address these questions. Azure Synapse analytics is a limitless analytics service that brings together data integration, data exploration, data warehouse, and big data analytics. This unified platform combines the needs of data engineering, […]
Fighting air pollution with data and AI
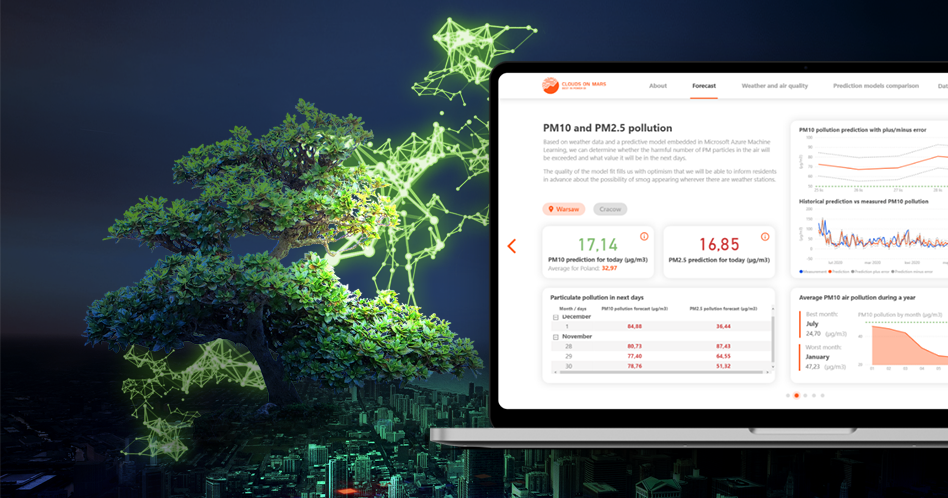
Clouds on Mars is not only Best in Modern BI, working with enterprise clients around the world and focusing on Microsoft technologies, but we are Carbon Negative as well. We are fully aware of impact on environment that comes with running a business, that is way they decided to eliminate whole carbon footprint […]
Useful tools for report design
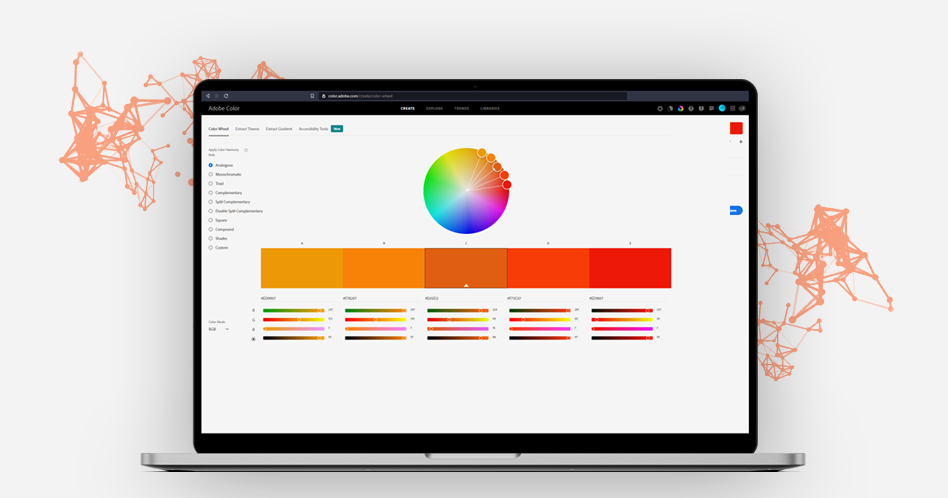
In today’s article I’d like to show you some examples of tools (other than Power BI) that you can incorporate into your report or dashboard design process and benefit quite a lot from. Using these tools you can improve overall look of your product and also make your life easier by working more effective. I […]
The art of data visualization

I want to talk about data visualisation today and raise the subject of how we can improve our data case studies. I want to show you one of my favourite data presentation. In this case, non interactive report – a book, The Annual Report of the ERGO Hestia Group made by Hanna Piotrowska (Dyrcz). […]
Data filtering and interactions in modern BI reports
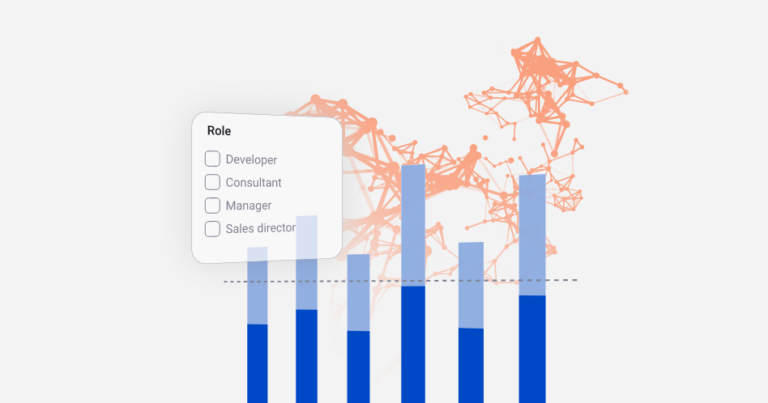
Power BI reports are much more advanced than classical, static BI reports when we’re talking interactivity. Our design should encourage user to click around and “play” with the visuals in order to find new insights and better understand the data behind it. Of course, it doesn’t mean we should enable all available cross filtering features […]
UX&UI – What’s the difference?
Maybe it’s only me but I often see that „UX/UI Designer” fraze is used like a magic spell on clients. What do I mean by that? From mine perspective, still many people can’t see the difference between those two subjects of design and today I want to give you a short explanation. […]
Problematic charts in data visualization – pros and cons
We all have specific preferences when it comes to certain charts and visuals. I know a lot of people love using piecharts and at the same time some people hate them. There aren’t strict rules about what chart to use, however some work best in given scenario, others not so much. You have to be […]
Choosing the right direction of your story

In my last article I was talking about how story is important and how we can visualise it in report design. Today I want to take a step back and show you that every story starts from simple „why and what?” Before you start designing you should ask client or end user some questions […]
Power Apps: Planning phase

Would you like to create your first business application in PowerApps, but don’t know where to start? Whether you’re a businessperson who has never participated in a software project before, or you’re a professional developer who wants to use Power Apps to simplify solutions – in our collection of articles you will find information about […]