We all have specific preferences when it comes to certain charts and visuals. I know a lot of people love using piecharts and at the same time some people hate them. There aren’t strict rules about what chart to use, however some work best in given scenario, others not so much. You have to be careful about what visual you use as it can impact your design, but most importantly your data can be misunderstood by the end user – and that’s not good.
Choosing the right graph for your data
We should always have in mind the type of data that we’re working with and what we want to show the audience. We should use certain graph when comparing data series, other when showing composition and other when showing trend over time. It’s important to know the basic types of visuals and when to use them.
Problematic charts
In data visualization world some types of charts are often used and liked by data visualization experts while other not so much. Let’s talk about few of them that I find most problematic and discuss their advantages and disadvantages.
Advantages and disadvantages of pie charts and donut charts
Okay, so let’s start with the most controversial types of visuals. Some people love pie charts, some people say to rather “Save them for the dessert”. As they may look good on your report page they aren’t that user friendly. Let’s see the examples below.
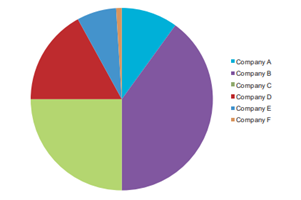
In the picture above you can easily see that Company C (green) takes 25% percent of the market. What will happen if we sort the slices by size?
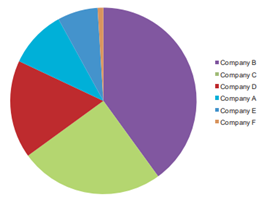
Now, as the Company C slice is rotated it’s not as easy to tell how much percentage Company C takes at the first glance. Our beautiful pie chart has become quite difficult to read – of course, you can what what company has the biggest value and so one, but it’s hard to tell specific proportions. What you can do now to improve the graph is add data labels and move the legend to corresponding slices.
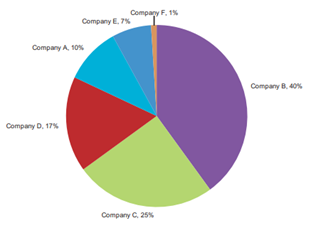
Now, data it’s much easier to see but what would you rather look at to compare proportions between series? Still, we can’t easily tell how much percentage is any specific slice, we have to look at data labels, so we could as well use simple data table. When we talk about design, another disadvantage of pie charts is that every slice needs to be coloured differently and uncontrolled “rainbow” in our project is not what we want in our projects. Bar chart would work much better in every aspect.
Read more about pie charts in the amazin paper by Stephen Few here.
As for the donut charts, they are basically the same as pie charts when it comes to proportions comparison. However I see one potential of donut charts use.

I think when pie charts shine the most is simply how cool they look. I think it’s fair to use them when showing progress in percentage, using only one data series. Yes, they aren’t as “straight-forward” as 100% stacked bar charts but as they have hole inside it’s a great place to put data label. I see this approach a lot in modern dashboard design and to me it just look great.
To sum things up:
- Pie charts shouldn’t be your visual of first choice when showing part to whole relationships
- Human eye is much better in comparing length than angle proportions – you’ll be better off using column or bar charts or even 100% stacked column or bar charts
- Pie charts don’t look that good anyway as they need much colors
- If you need to use pie chart, remember to show data labels and show legend next to corresponding slice
Stacked area charts
Stacked area charts are used to show part-to-whole relationship over time – each area contributes to the total. The problem with area charts is that not everyone understands them properly. One might think that series A B and C overlap, meaning they all start at 0. That is not true for stacked area charts as each series representations starts where previous ends.
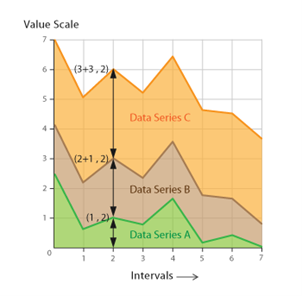
I see the danger of misunderstanding stacked area charts as the eye naturally gazes to the maximum value of each line – not everyone will perceive what they are supposed to: vertical thickness of each area.
So, use stacked area charts cautiously and make sure that your audience understands them correctly.
100% stacked area charts
Well, 100% stacked area charts are even more problematic and might lead to wrong conclusions and misunderstanding of the data. Dr. Drang wrote a great article about the problem, you can see it here. So, let’slook at the case of 100% stacked area charts.
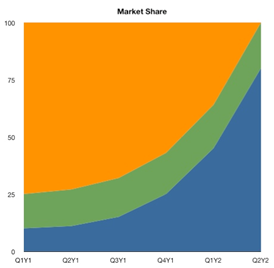
The graph shows market share of three companies A B C over time. You can clearly see that orange company market share has decreased and blue company increased. But how green company has changed over time? It looks like it’s market share also decreased but let’s look at the data below the chart in tabular form:
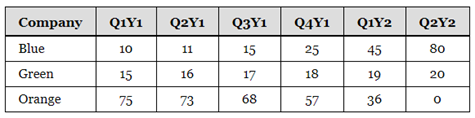
You can clearly see that green company market share was increasing the whole time. Weird, isn’t it? Well, that’s because our mind is playing tricks on us.
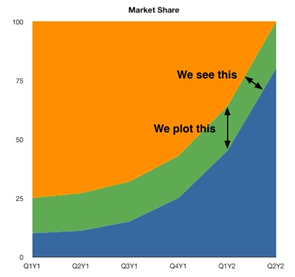
We simply don’t perceive what is plotted on the graph – we rather see the thickness of green area. This is why 100% stacked area charts might be confusing for a lot of people – you have to be very careful when using them. Or, you can simply use a 100% stacked column chart.
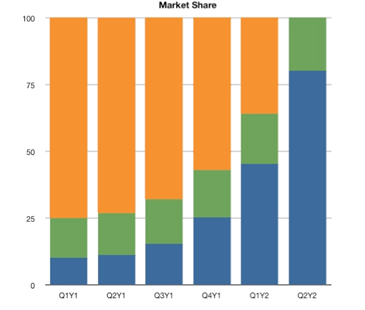
It looks more boring compared to previous solution but is way more effective and that’s what you should have in mind when choosing the right visual.
Treemaps
Last type of chart that I want to talk about is treemap. Some people like them, some don’t. I’m part of the second group.
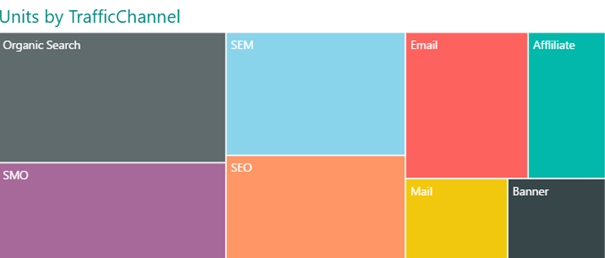
Similarly to pie charts, tree maps are in my opinion difficult to read when it comes to comparing proportions. It’s a little easier this way as we compare areas rather than angles but still I think that comparing length is far more effective. Another downside of treemap is that we loose control over design of our report as it needs a lot of different colors which might be frustrating when choosing a color palette (especially when our report has to be color blindness friendly).
In my opinion, treemaps might be a good choice when we’re not working with a big number of data series and we want it to be used as a cross-filtering slicer – that might freshen up our design a little bit.
Conclusions
Having all above in mind remember to select charts for your reports and dashboards cautiously and consciously. Always have in mind what story you want to show the audience and think about the challenges that each type of visualization comes with. I don’t mean that you have to use column charts all the time (although they work surprisingly good a lot of time) – just be aware of all advantages and disadvantages and choose what works best in given case.
Michał Stryjczak
Read more:
How adopting UX can improve your BI